
Noseberry Digitals
Real Estate Data Analytics: What It Is and What Your Business Needs to Make It Work
Published March 31, 2026|6 min read

Most property businesses are sitting on more data than they realise. Rent payment records, maintenance histories, occupancy trends, lease expiry profiles, valuation changes, tenant satisfaction scores, and portfolio performance figures all accumulate continuously in the systems the business uses every day. The question is not whether the data exists. It is whether it is being […]
Most property businesses are sitting on more data than they realise. Rent payment records, maintenance histories, occupancy trends, lease expiry profiles, valuation changes, tenant satisfaction scores, and portfolio performance figures all accumulate continuously in the systems the business uses every day. The question is not whether the data exists. It is whether it is being used. Real estate data analytics is the discipline of collecting that data, structuring it properly, and analysing it in ways that produce insight the business can act on. This article explains what that means in practice, what types of analytics are relevant to property businesses, and what you need in place before analytics can deliver its potential.
The Data Problem Most Property Businesses Have
The typical property business holds its data across several disconnected systems: a property management platform, an accounting package, a CRM, a maintenance tool, and several spreadsheets maintained by individual team members. Each of these systems captures a portion of the picture. None of them, alone, provides a complete view of portfolio performance. And because they do not connect to each other, producing a complete view requires a manual exercise of extracting data from each system, reconciling the differences, and assembling the figures into a report. This process takes time, introduces errors, and produces a snapshot that is already historical by the time it reaches the decision-makers who need it. More importantly, it limits the questions the business can ask. When the data is fragmented, the only analyses that are practical are the ones simple enough to be done manually. The deeper questions, the ones about patterns, trends, and predictions, remain unanswered.
What Real Estate Data Analytics Actually Means
Real estate data analytics is the process of making the data the business holds useful for decision-making. It starts with data collection and consolidation: bringing data from all the systems in the business into a single, structured environment where it can be analysed together. It continues with data quality management: ensuring the data is accurate, complete, and consistently formatted so that the analyses built on top of it produce reliable results. It then builds the analytical layer: the reports, dashboards, models, and tools that allow business users to ask questions of the data and receive answers they can act on. The goal is not to produce more reports. It is to reduce the time between a question arising and a reliable answer being available, and to make that answer specific enough to inform a decision.
The Types of Analytics Used in Property
Analytics is not a single thing. It operates across a spectrum from simple to sophisticated, and each level serves a different purpose. Descriptive analytics answers the question: what happened? It summarises historical data into reports and dashboards that show what the portfolio has done: occupancy rates over the past 12 months, rent collected versus invoiced, maintenance costs by property and category, arrears levels by age. Diagnostic analytics answers the question: why did it happen? It goes beyond the summary to identify the factors that drove a particular outcome. Why did occupancy drop in a specific building last quarter? Which maintenance categories are driving cost overruns? Why is one agent’s conversion rate significantly higher than the team average? Predictive analytics answers the question: what is likely to happen? It uses historical patterns to forecast future outcomes. Which leases are most likely not to renew? Which properties are at risk of a maintenance cost spike? What is the expected void for the portfolio over the next six months? Prescriptive analytics answers the question: what should we do? It combines prediction with optimisation to recommend specific actions. Which tenants should be contacted first for renewal? Which properties should be prioritised for capital investment? What pricing strategy maximises yield for a specific unit type in a specific location? Most property businesses are operating at the descriptive level. Moving into diagnostic and predictive analytics is where the competitive advantage begins to emerge.
What Questions Analytics Can Answer
The value of analytics is best understood through the questions it makes answerable quickly and reliably. Operational questions: What is our current occupancy across the portfolio? Which tenants are in arrears and for how long? What is the average maintenance resolution time by category and contractor? Which properties have the highest maintenance cost per unit? Financial questions: How is actual expenditure tracking against budget by property and cost centre? What is the portfolio’s net operating income compared to the same period last year? Which properties are delivering below their expected yield and why? Strategic questions: What does the lease expiry profile look like across the portfolio over the next 24 months, and what is the potential revenue at risk? Which segments of the portfolio are growing in value and which are declining? Where are the highest-risk assets in the portfolio from a financial and operational perspective? Tenant questions: What is the renewal rate trend and how does it compare across different property types and management teams? What factors correlate most strongly with tenant non-renewal? Which tenants are showing early signs of dissatisfaction based on their maintenance and communication history?
Who Uses Data Analytics in a Property Business
Data analytics serves different roles across a property organisation. The finance team uses analytics for budget versus actual tracking, arrears monitoring, cash flow forecasting, and period-end reporting. For them, analytics reduces the manual data assembly that currently consumes significant time each month. The operations team uses analytics for maintenance performance tracking, contractor assessment, compliance monitoring, and portfolio condition management. For them, analytics surfaces the problems that would otherwise only become visible when they reach a crisis point. Leadership uses analytics for portfolio performance oversight, strategic allocation decisions, investor reporting, and market positioning. For them, analytics replaces the delayed, manually assembled report with a real-time view that supports faster and better-informed decisions. The leasing team uses analytics for demand analysis, pricing optimisation, conversion rate tracking, and renewal prediction. For them, analytics identifies where to direct effort and what pricing positions are most likely to succeed.
The Foundation You Need Before Analytics Works
Analytics is built on data. If the data is incomplete, inconsistent, or held in systems that cannot be connected, the analytical layer built on top of it will produce unreliable results. The foundation for effective real estate analytics has three components. Data consolidation: all relevant data sources connected to a central analytics environment, whether a data warehouse, a business intelligence platform, or a well-integrated property management system with built-in reporting. Data quality: a consistent standard for how data is entered and maintained across all systems. Property names, tenant identifiers, cost categories, and date formats must be consistent across all data sources for analyses that cross system boundaries to be reliable. Data governance: defined ownership of each data domain, clear rules for how data is recorded and updated, and a process for identifying and correcting quality issues over time. These foundations are not exciting to build. But without them, analytics investment produces dashboards that people do not trust and insights that do not hold up to scrutiny. Our Data Management and Business Intelligence Software page covers how we help property businesses build the data infrastructure that makes analytics reliable and valuable.
Conclusion
The data advantage in property is not reserved for the largest portfolios or the most sophisticated operators. It is available to any business that is willing to consolidate its data, maintain it properly, and build the analytical layer on top of it that turns records into decisions. Most property businesses are closer to that point than they realise. The data is already there. The gap is usually not the volume of data but the structure it is held in and the tools available to interrogate it.
Why trust Noseberry
Our content is written by practicing real-estate and PropTech professionals, fact-checked by a dedicated editorial team, and reviewed against the latest industry data before publication.
- 10+ years of industry expertise
- All facts independently verified
- No sponsored rankings in guides
- Updated when the industry changes
Related insights
 Real Estate
What Role Does SEO Play in Lead Generation for Real Estate Agents?
Most real estate agents either ignore SEO entirely or treat it as a branding exercise with no connection to their actual pipeline. This guide breaks down exactly what role SEO plays in lead generation for real estate agents, from the moment a buyer types a search query to the moment they book a call with you. You'll get the specific hacks that move map pack rankings, a clear comparison of SEO versus paid ads, and an explanation of AEO and GEO, the new lead sources that most agents haven't discovered yet. Every tactic is mapped to a sales outcome, not just a traffic metric. If you want an organic pipeline that keeps producing leads whether or not you're running ads, this is where you start.
July 3, 2026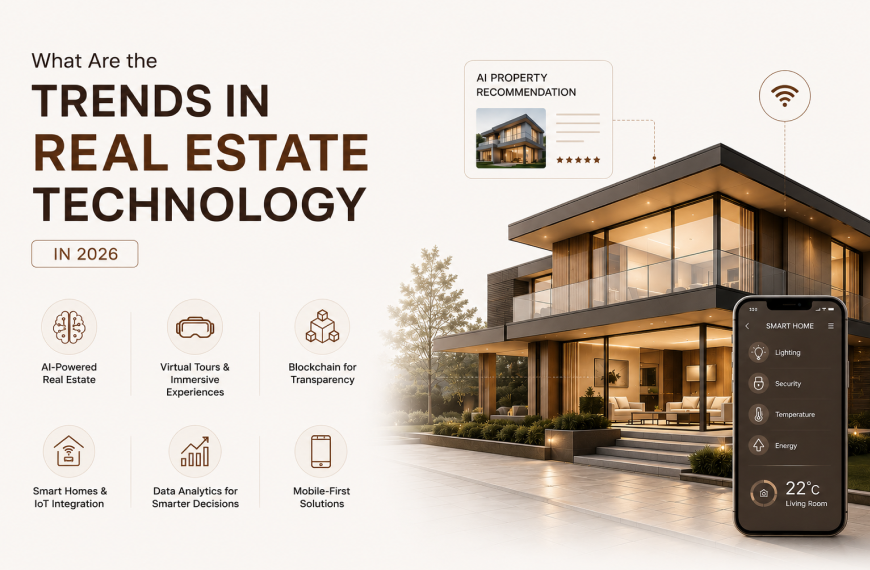 Real Estate
What Are the Trends in Real Estate Technology in 2026
Real estate technology isn't evolving gradually anymore, it's accelerating fast, and most property businesses are already behind. This guide breaks down the trends actually moving the needle in 2026: agentic AI, predictive seller analytics, digital twins, drone data collection, and AI-enhanced CRMs. You'll see real adoption numbers, documented sales impact, and a clear framework for deciding which trend to act on first. Instead of a generic trend list, this post connects each innovation to a specific business outcome. If you want to know what's actually worth your attention this year, start here.
July 3, 2026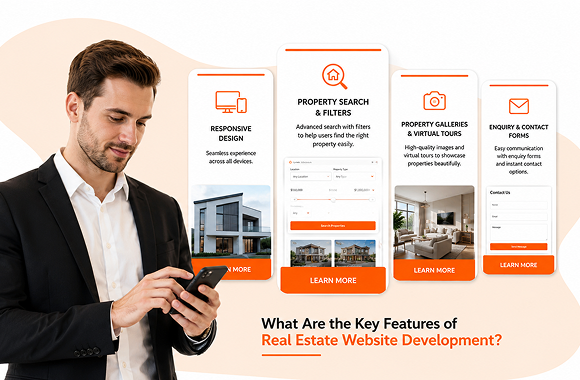 Real Estate
What Are the Key Features of Real Estate Website Development?
This guide breaks down the key features of real estate website development: IDX/MLS property search, lead capture tools, mobile-first design, immersive visuals, SEO, and CRM integration. It explains why IDX drives roughly four times the traffic, how multi-step forms convert better, and why over 75% mobile traffic makes speed essential. Backed by data from Luxury Presence, iHomefinder, and Placester, it shows how the features work together as a lead funnel. The takeaway: build the funnel first, since a website's real job is to generate and convert leads.
July 2, 2026
Ready to book a 30-minute strategy call?
We'll map the right digital moves for your real estate business, no pitch deck, no commitment.